Trackbars & UI Controls
Trackbars (sliders) are OpenCV’s simplest built-in UI widget for interactive parameter tuning. When you are searching for the right threshold value, the best kernel size, or an optimal color range, a trackbar lets you adjust values in real time and see the result immediately. Combined with OpenCV’s drawing functions, trackbars enable powerful rapid-prototyping tools without any external GUI framework. Every example on this page creates canvases with np.zeros() so you can run them without any external images.
Creating Trackbars
Section titled “Creating Trackbars”The core function is cv2.createTrackbar:
cv2.createTrackbar(trackbarName, windowName, value, count, onChange)| Parameter | Description |
|---|---|
trackbarName | Label displayed next to the slider. |
windowName | Name of the existing window to attach the trackbar to. |
value | Initial position of the slider. |
count | Maximum value the slider can reach (minimum is always 0). |
onChange | Callback function invoked every time the slider moves. Receives a single int argument — the new position. |
OpenCV also provides companion functions for reading and writing trackbar state:
cv2.getTrackbarPos(trackbarName, windowName)— returns the current position as anint.cv2.setTrackbarPos(trackbarName, windowName, pos)— moves the slider programmatically.cv2.setTrackbarMin(trackbarName, windowName, minval)— sets a minimum value (OpenCV 3.4+).cv2.setTrackbarMax(trackbarName, windowName, maxval)— changes the maximum value at runtime.
Minimal Example — Brightness Slider
Section titled “Minimal Example — Brightness Slider”import cv2import numpy as np
cv2.namedWindow("Brightness")cv2.createTrackbar("Value", "Brightness", 0, 255, lambda x: None)
while True: brightness = cv2.getTrackbarPos("Value", "Brightness")
# Create a blank canvas filled with the trackbar value canvas = np.zeros((300, 400, 3), dtype=np.uint8) canvas[:] = (brightness, brightness, brightness)
cv2.imshow("Brightness", canvas) if cv2.waitKey(1) & 0xFF == ord("q"): break
cv2.destroyAllWindows()Drag the slider from 0 (black) to 255 (white) and the canvas updates instantly.
The Callback Pattern
Section titled “The Callback Pattern”Every trackbar requires a callback function. It receives a single integer argument — the new slider position. For the simplest cases, pass a no-op lambda:
cv2.createTrackbar("Size", "Window", 5, 100, lambda x: None)This is perfectly valid. The lambda discards the value, and your main loop reads positions with cv2.getTrackbarPos whenever it needs them.
For more complex interfaces with multiple trackbars, the polling pattern keeps all logic centralized in the main loop instead of scattered across individual callbacks:
import cv2import numpy as np
cv2.namedWindow("Color Mixer")cv2.createTrackbar("Red", "Color Mixer", 0, 255, lambda x: None)cv2.createTrackbar("Green", "Color Mixer", 0, 255, lambda x: None)cv2.createTrackbar("Blue", "Color Mixer", 0, 255, lambda x: None)
while True:    r = cv2.getTrackbarPos("Red", "Color Mixer")    g = cv2.getTrackbarPos("Green", "Color Mixer")    b = cv2.getTrackbarPos("Blue", "Color Mixer")
    canvas = np.zeros((300, 400, 3), dtype=np.uint8)    canvas[:] = (b, g, r)  # OpenCV uses BGR order
    cv2.putText(canvas, f"RGB({r}, {g}, {b})", (20, 280),                cv2.FONT_HERSHEY_SIMPLEX, 0.7, (255, 255, 255), 2)
    cv2.imshow("Color Mixer", canvas)    if cv2.waitKey(1) & 0xFF == ord("q"):        break
cv2.destroyAllWindows()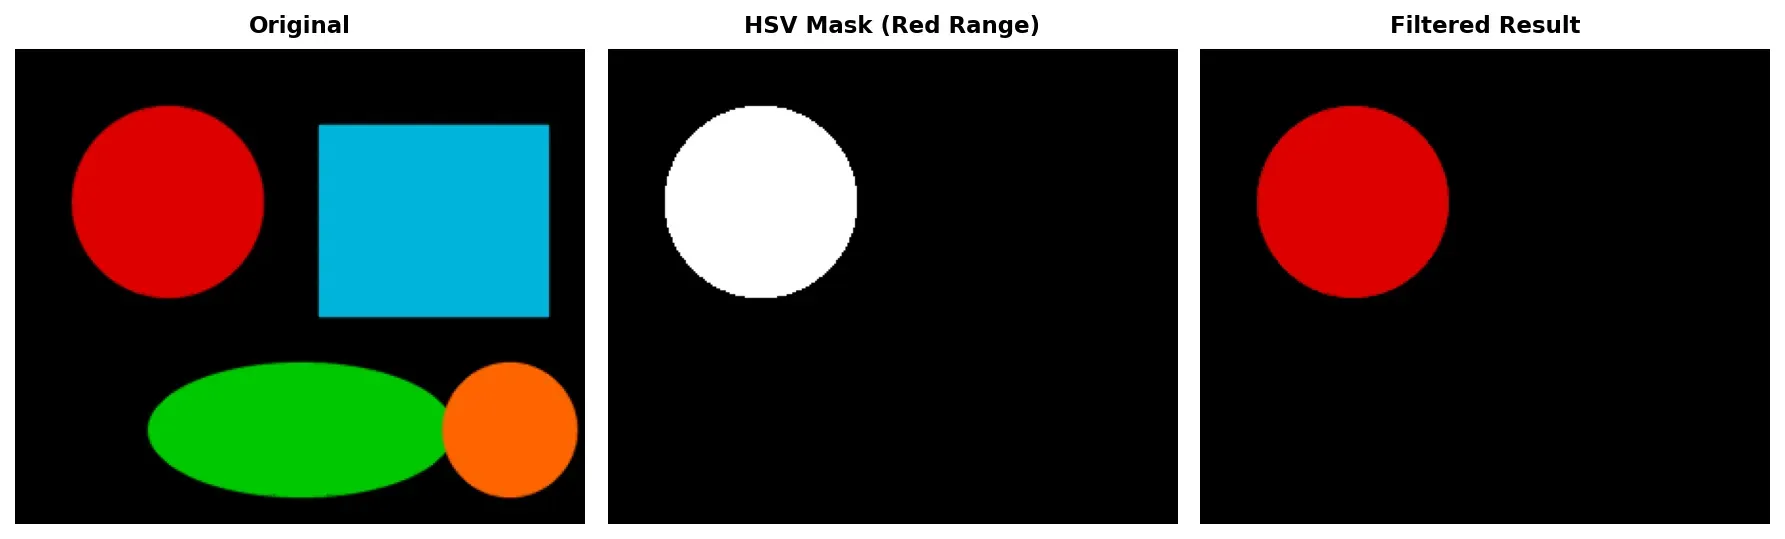
Practical Example — HSV Color Range Picker
Section titled “Practical Example — HSV Color Range Picker”One of the most useful trackbar demos is an HSV color range picker. When building color-based segmentation, you need to find the right lower and upper HSV bounds — six trackbars make this interactive.
import cv2import numpy as np
cv2.namedWindow("HSV Range Picker")cv2.createTrackbar("H min", "HSV Range Picker", 0, 179, lambda x: None)cv2.createTrackbar("S min", "HSV Range Picker", 0, 255, lambda x: None)cv2.createTrackbar("V min", "HSV Range Picker", 0, 255, lambda x: None)cv2.createTrackbar("H max", "HSV Range Picker", 179, 179, lambda x: None)cv2.createTrackbar("S max", "HSV Range Picker", 255, 255, lambda x: None)cv2.createTrackbar("V max", "HSV Range Picker", 255, 255, lambda x: None)
while True:    sample = np.zeros((300, 400, 3), dtype=np.uint8)    cv2.circle(sample, (100, 150), 60, (0, 0, 255), -1)    cv2.rectangle(sample, (180, 80), (280, 220), (0, 255, 0), -1)    cv2.circle(sample, (340, 150), 50, (255, 0, 0), -1)    cv2.ellipse(sample, (200, 260), (80, 30), 0, 0, 360, (0, 255, 255), -1)    h_min = cv2.getTrackbarPos("H min", "HSV Range Picker")    s_min = cv2.getTrackbarPos("S min", "HSV Range Picker")    v_min = cv2.getTrackbarPos("V min", "HSV Range Picker")    h_max = cv2.getTrackbarPos("H max", "HSV Range Picker")    s_max = cv2.getTrackbarPos("S max", "HSV Range Picker")    v_max = cv2.getTrackbarPos("V max", "HSV Range Picker")    lower = np.array([h_min, s_min, v_min])    upper = np.array([h_max, s_max, v_max])    hsv = cv2.cvtColor(sample, cv2.COLOR_BGR2HSV)    mask = cv2.inRange(hsv, lower, upper)    result = cv2.bitwise_and(sample, sample, mask=mask)    cv2.imshow("HSV Range Picker", sample)    cv2.imshow("Mask", mask)    cv2.imshow("Filtered Result", result)    if cv2.waitKey(1) & 0xFF == ord("q"):        break
cv2.destroyAllWindows()
Adjust the six sliders to isolate specific colors. The mask window shows the binary result of cv2.inRange, and the filtered result shows only the matching pixels.
Practical Example — Real-Time Blur Adjuster
Section titled “Practical Example — Real-Time Blur Adjuster”Gaussian blur requires an odd kernel size. A trackbar that goes from 1 to 50 can be converted to an odd value with ksize = val * 2 + 1, guaranteeing valid kernels from 3 to 101.
import cv2import numpy as np
canvas = np.zeros((300, 400, 3), dtype=np.uint8)cv2.rectangle(canvas, (50, 50), (150, 150), (0, 255, 0), -1)cv2.circle(canvas, (280, 100), 50, (0, 0, 255), -1)cv2.putText(canvas, "OpenCV", (100, 250), cv2.FONT_HERSHEY_SIMPLEX, 1.2,            (255, 255, 255), 2)cv2.namedWindow("Blur Adjuster")cv2.createTrackbar("Kernel", "Blur Adjuster", 0, 50, lambda x: None)cv2.createTrackbar("Sigma", "Blur Adjuster", 0, 20, lambda x: None)
while True:    val = cv2.getTrackbarPos("Kernel", "Blur Adjuster")    sigma = cv2.getTrackbarPos("Sigma", "Blur Adjuster")    if val == 0:        blurred = canvas.copy()    else:        ksize = val * 2 + 1        blurred = cv2.GaussianBlur(canvas, (ksize, ksize), sigma)    display = blurred.copy()    cv2.putText(display, f"Kernel: {val*2+1}x{val*2+1}  Sigma: {sigma}",                (10, 290), cv2.FONT_HERSHEY_SIMPLEX, 0.5, (200, 200, 200), 1)
    cv2.imshow("Blur Adjuster", display)    if cv2.waitKey(1) & 0xFF == ord("q"):        break
cv2.destroyAllWindows()
When the kernel trackbar is at 0, no blur is applied. As you increase it, shapes and text progressively soften. Setting sigma to 0 lets OpenCV calculate it automatically from the kernel size.
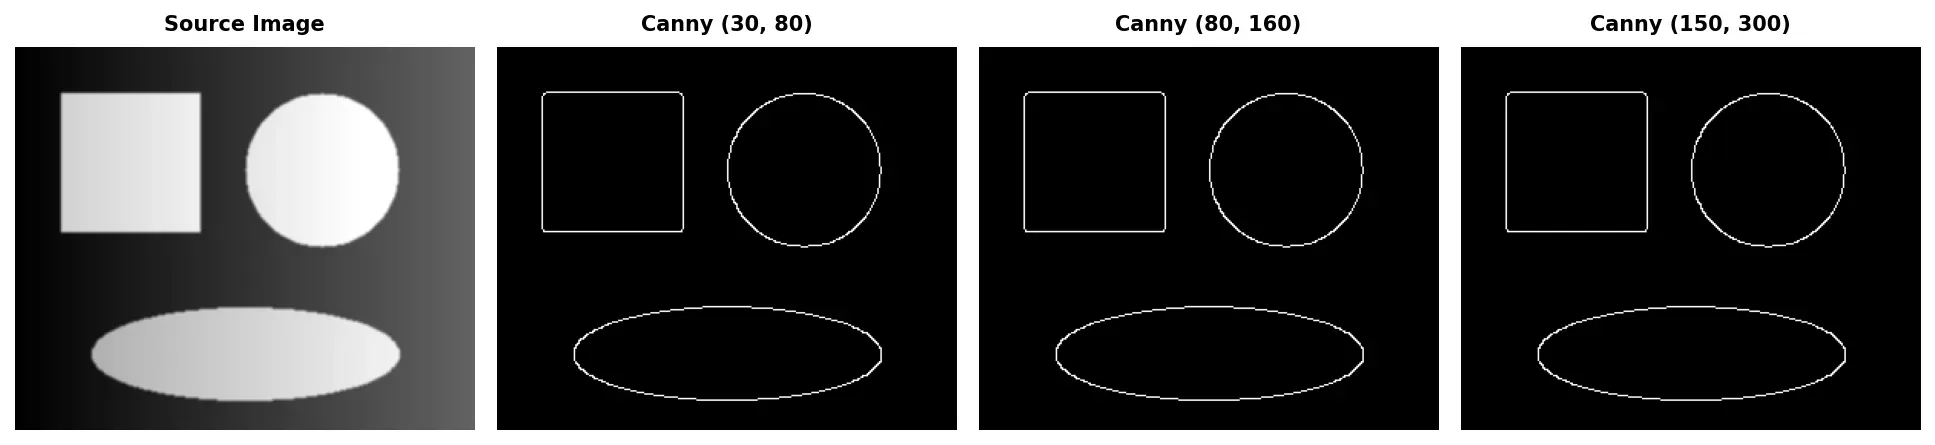
Practical Example — Canny Edge Detection Tuner
Section titled “Practical Example — Canny Edge Detection Tuner”Canny edge detection is highly sensitive to its two threshold parameters. A trackbar interface lets you find optimal values instantly.
import cv2import numpy as npcanvas = np.zeros((300, 400, 3), dtype=np.uint8)cv2.rectangle(canvas, (30, 30), (130, 130), (255, 255, 255), 2)cv2.circle(canvas, (220, 80), 50, (200, 200, 200), -1)cv2.line(canvas, (300, 20), (380, 140), (150, 150, 150), 3)cv2.ellipse(canvas, (200, 220), (100, 40), 30, 0, 360, (180, 180, 180), -1)cv2.putText(canvas, "Edges", (50, 260), cv2.FONT_HERSHEY_SIMPLEX, 1.5,            (120, 120, 120), 3)gray = cv2.cvtColor(canvas, cv2.COLOR_BGR2GRAY)cv2.namedWindow("Canny Tuner")cv2.createTrackbar("Threshold 1", "Canny Tuner", 50, 500, lambda x: None)cv2.createTrackbar("Threshold 2", "Canny Tuner", 150, 500, lambda x: None)
while True:    t1 = cv2.getTrackbarPos("Threshold 1", "Canny Tuner")    t2 = cv2.getTrackbarPos("Threshold 2", "Canny Tuner")    edges = cv2.Canny(gray, t1, t2)    edges_bgr = cv2.cvtColor(edges, cv2.COLOR_GRAY2BGR)    combined = np.hstack([canvas, edges_bgr])    cv2.putText(combined, f"T1: {t1}  T2: {t2}", (420, 290),                cv2.FONT_HERSHEY_SIMPLEX, 0.5, (0, 255, 0), 1)    cv2.imshow("Canny Tuner", combined)    if cv2.waitKey(1) & 0xFF == ord("q"):        break
cv2.destroyAllWindows()
The left half shows the original image and the right half shows detected edges. Lower thresholds produce more edges (including noise), while higher thresholds keep only the strongest gradients. A common guideline is threshold2 roughly 2–3x threshold1.
Practical Example — Combining Mouse Events and Trackbars
Section titled “Practical Example — Combining Mouse Events and Trackbars”This capstone example builds a mini drawing application combining trackbars for tool configuration, mouse events for interaction, and keyboard shortcuts for tool switching.
import cv2import numpy as np
canvas = np.zeros((500, 700, 3), dtype=np.uint8)drawing = Falsestart_x, start_y = -1, -1tool = "circle"
def mouse_callback(event, x, y, flags, param):    global drawing, start_x, start_y, canvas    win = "Drawing App"    size = cv2.getTrackbarPos("Brush Size", win)    r = cv2.getTrackbarPos("Red", win)    g = cv2.getTrackbarPos("Green", win)    b = cv2.getTrackbarPos("Blue", win)    color = (b, g, r)    if event == cv2.EVENT_LBUTTONDOWN:        drawing = True        start_x, start_y = x, y    elif event == cv2.EVENT_MOUSEMOVE:        if drawing and tool == "circle":            cv2.circle(canvas, (x, y), size, color, -1)    elif event == cv2.EVENT_LBUTTONUP:        drawing = False        if tool == "line":            cv2.line(canvas, (start_x, start_y), (x, y), color, size)        elif tool == "rectangle":            cv2.rectangle(canvas, (start_x, start_y), (x, y), color, size)        elif tool == "circle":            cv2.circle(canvas, (x, y), size, color, -1)
cv2.namedWindow("Drawing App")cv2.createTrackbar("Brush Size", "Drawing App", 5, 50, lambda x: None)cv2.createTrackbar("Red", "Drawing App", 255, 255, lambda x: None)cv2.createTrackbar("Green", "Drawing App", 255, 255, lambda x: None)cv2.createTrackbar("Blue", "Drawing App", 255, 255, lambda x: None)cv2.setMouseCallback("Drawing App", mouse_callback)
while True:    display = canvas.copy()    cv2.putText(display, f"Tool: {tool}", (10, 30),                cv2.FONT_HERSHEY_SIMPLEX, 0.7, (0, 255, 255), 2)    cv2.putText(display, "Keys: [c]ircle [l]ine [r]ect [s]ave [q]uit", (10, 490),                cv2.FONT_HERSHEY_SIMPLEX, 0.5, (150, 150, 150), 1)    cv2.imshow("Drawing App", display)    key = cv2.waitKey(1) & 0xFF    if key == ord("q"):        break    elif key == ord("l"):        tool = "line"    elif key == ord("r"):        tool = "rectangle"    elif key == ord("c"):        tool = "circle"    elif key == ord("s"):        cv2.imwrite("drawing_output.png", canvas)        print("Saved drawing_output.png")
cv2.destroyAllWindows()
Trackbars control brush size and RGB color. The mouse callback reads positions each time it fires, so changes take effect immediately. Mouse events handle drawing — click-and-drag with circle paints freehand, while line and rectangle draw between press and release points. Keyboard shortcuts switch tools: l line, r rectangle, c circle, s save, q quit. This pattern scales well to more complex prototyping tools like annotation editors and ROI selectors.