Markers & Arrows
Markers and arrows are specialized drawing functions for annotation. Arrows indicate direction or flow, markers highlight specific points of interest. These are essential when visualizing optical flow, keypoints, motion vectors, or building annotated datasets.
Drawing Arrows — cv2.arrowedLine()
Section titled “Drawing Arrows — cv2.arrowedLine()”cv2.arrowedLine() draws a line segment with an arrowhead at the endpoint:
cv2.arrowedLine(img, pt1, pt2, color, thickness=1, line_type=cv2.LINE_8, shift=0, tipLength=0.1)pt1— start point (tail),pt2— end point (tip)tipLength— arrowhead length as a fraction of total line length (default0.1)
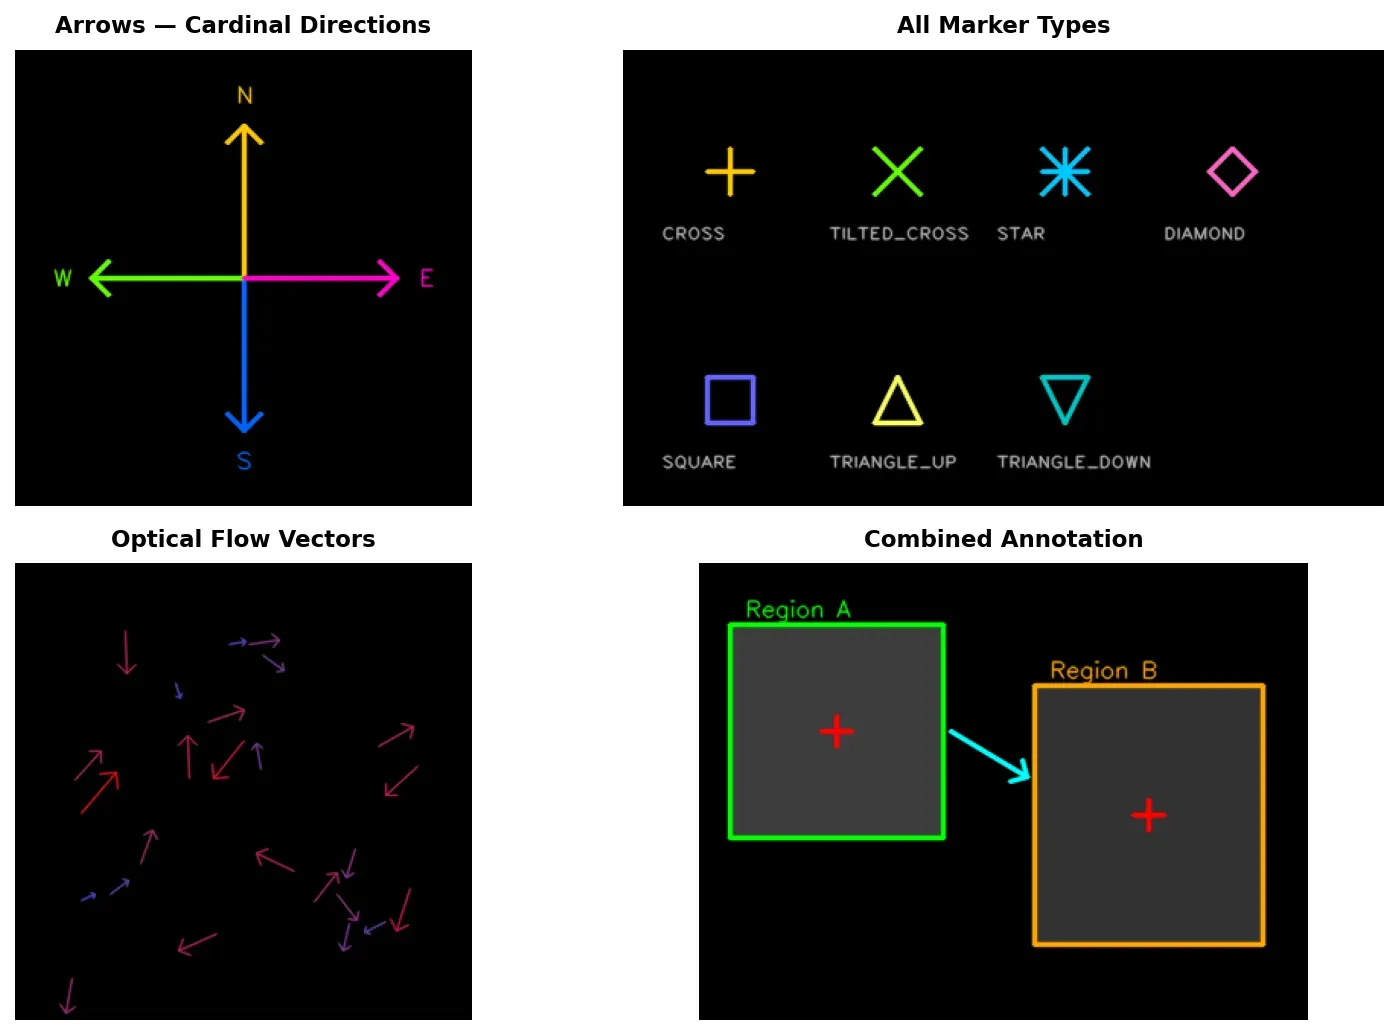
Cardinal Direction Arrows
Section titled “Cardinal Direction Arrows”import cv2import numpy as np
canvas = np.zeros((400, 400, 3), dtype=np.uint8)cx, cy, length = 200, 200, 120
cv2.arrowedLine(canvas, (cx, cy), (cx, cy - length), (0, 255, 0), 2, tipLength=0.15) # Upcv2.arrowedLine(canvas, (cx, cy), (cx, cy + length), (0, 0, 255), 2, tipLength=0.15) # Downcv2.arrowedLine(canvas, (cx, cy), (cx - length, cy), (255, 0, 0), 2, tipLength=0.15) # Leftcv2.arrowedLine(canvas, (cx, cy), (cx + length, cy), (255, 255, 0), 2, tipLength=0.15) # Right
cv2.imshow("Cardinal Arrows", canvas)cv2.waitKey(0)cv2.destroyAllWindows()Flow and Motion Vectors
Section titled “Flow and Motion Vectors”Paired points representing before/after positions are naturally visualized with arrows:
import cv2import numpy as np
canvas = np.zeros((400, 500, 3), dtype=np.uint8)motions = [    ((80, 300), (150, 200)),    ((200, 350), (250, 250)),    ((320, 280), (400, 220)),    ((100, 100), (180, 130)),]
for start, end in motions:    cv2.circle(canvas, start, 3, (100, 100, 100), -1)    cv2.arrowedLine(canvas, start, end, (0, 255, 255), 2, tipLength=0.2)
cv2.imshow("Motion Vectors", canvas)cv2.waitKey(0)cv2.destroyAllWindows()Drawing Markers — cv2.drawMarker()
Section titled “Drawing Markers — cv2.drawMarker()”cv2.drawMarker() places a predefined marker symbol at a given point:
cv2.drawMarker(img, position, color, markerType=cv2.MARKER_CROSS, markerSize=20, thickness=1)OpenCV provides seven marker types:
| Constant | Description |
|---|---|
MARKER_CROSS | Cross + (default) |
MARKER_TILTED_CROSS | 45-degree rotated cross x |
MARKER_STAR | 8-pointed star (cross + tilted cross) |
MARKER_DIAMOND / MARKER_SQUARE | Diamond / axis-aligned square |
MARKER_TRIANGLE_UP / MARKER_TRIANGLE_DOWN | Upward / downward triangle |
All Marker Types on a Canvas
Section titled “All Marker Types on a Canvas”import cv2import numpy as np
canvas = np.zeros((200, 700, 3), dtype=np.uint8)markers = [ (cv2.MARKER_CROSS, "CROSS"), (cv2.MARKER_TILTED_CROSS, "TILTED"), (cv2.MARKER_STAR, "STAR"), (cv2.MARKER_DIAMOND, "DIAMOND"), (cv2.MARKER_SQUARE, "SQUARE"), (cv2.MARKER_TRIANGLE_UP, "TRI UP"), (cv2.MARKER_TRIANGLE_DOWN, "TRI DOWN"),]for i, (marker_type, label) in enumerate(markers): x = 50 + i * 90 cv2.drawMarker(canvas, (x, 80), (0, 255, 0), marker_type, markerSize=30, thickness=2) cv2.putText(canvas, label, (x - 30, 140), cv2.FONT_HERSHEY_SIMPLEX, 0.4, (200, 200, 200), 1)
cv2.imshow("Marker Types", canvas)cv2.waitKey(0)cv2.destroyAllWindows()Marking Detected Keypoints
Section titled “Marking Detected Keypoints”Simulate detected keypoints (e.g., corners) and mark them on a canvas:
import cv2import numpy as np
canvas = np.zeros((400, 400, 3), dtype=np.uint8)cv2.rectangle(canvas, (50, 50), (180, 180), (80, 80, 80), -1)cv2.rectangle(canvas, (220, 200), (370, 350), (60, 60, 60), -1)
keypoints = [(50, 50), (180, 50), (50, 180), (180, 180),             (220, 200), (370, 200), (220, 350), (370, 350)]
for pt in keypoints:    cv2.drawMarker(canvas, pt, (0, 0, 255), cv2.MARKER_TILTED_CROSS, markerSize=15, thickness=2)
cv2.imshow("Detected Keypoints", canvas)cv2.waitKey(0)cv2.destroyAllWindows()Practical Example — Annotating an Image with Multiple Elements
Section titled “Practical Example — Annotating an Image with Multiple Elements”A complete annotation combines drawing primitives: rectangles for regions of interest, arrows pointing between them, markers on key points, and text labels.
import cv2import numpy as np
canvas = np.zeros((500, 700, 3), dtype=np.uint8)cv2.rectangle(canvas, (50, 100), (250, 300), (0, 255, 0), 2)cv2.rectangle(canvas, (400, 150), (600, 350), (255, 0, 0), 2)cv2.putText(canvas, "Region A", (80, 90), cv2.FONT_HERSHEY_SIMPLEX, 0.7, (0, 255, 0), 2)cv2.putText(canvas, "Region B", (430, 140), cv2.FONT_HERSHEY_SIMPLEX, 0.7, (255, 0, 0), 2)cv2.arrowedLine(canvas, (255, 200), (395, 250), (0, 255, 255), 2, tipLength=0.08)cv2.putText(canvas, "flow", (300, 210), cv2.FONT_HERSHEY_SIMPLEX, 0.5, (0, 255, 255), 1)for pt in [(100, 150), (200, 250), (150, 200)]:    cv2.drawMarker(canvas, pt, (0, 200, 200), cv2.MARKER_STAR, markerSize=15, thickness=1)for pt in [(450, 200), (550, 300), (500, 260)]:    cv2.drawMarker(canvas, pt, (200, 200, 0), cv2.MARKER_DIAMOND, markerSize=15, thickness=1)cv2.arrowedLine(canvas, (150, 400), (150, 260), (255, 255, 255), 1, tipLength=0.15)cv2.putText(canvas, "centroid", (90, 430), cv2.FONT_HERSHEY_SIMPLEX, 0.5, (255, 255, 255), 1)
cv2.imshow("Full Annotation", canvas)cv2.waitKey(0)cv2.destroyAllWindows()
Practical Example — Visualizing Optical Flow Vectors
Section titled “Practical Example — Visualizing Optical Flow Vectors”Given arrays of points before and after movement, arrows show displacement. Color coding by magnitude helps distinguish fast from slow motion:
import cv2import numpy as np
canvas = np.zeros((500, 500, 3), dtype=np.uint8)np.random.seed(42)prev_pts = np.random.randint(50, 450, size=(40, 2))dx = np.random.randint(5, 50, size=(40, 1))dy = np.random.randint(-20, 20, size=(40, 1))next_pts = prev_pts + np.hstack([dx, dy])
for i in range(len(prev_pts)):    x1, y1 = int(prev_pts[i][0]), int(prev_pts[i][1])    x2, y2 = int(next_pts[i][0]), int(next_pts[i][1])    magnitude = np.sqrt((x2 - x1) ** 2 + (y2 - y1) ** 2)    # Map magnitude to color: low motion (blue) -> high motion (red)    ratio = min(magnitude / 60.0, 1.0)    color = (int(255 * (1 - ratio)), 0, int(255 * ratio))    cv2.circle(canvas, (x1, y1), 2, (100, 100, 100), -1)    cv2.arrowedLine(canvas, (x1, y1), (x2, y2), color, 1, tipLength=0.25)
cv2.putText(canvas, "Blue = low motion", (10, 470), cv2.FONT_HERSHEY_SIMPLEX, 0.5, (255, 0, 0), 1)cv2.putText(canvas, "Red = high motion", (10, 490), cv2.FONT_HERSHEY_SIMPLEX, 0.5, (0, 0, 255), 1)
cv2.imshow("Optical Flow Vectors", canvas)cv2.waitKey(0)cv2.destroyAllWindows()